Introduction
The Boston Consulting Group matrix or BCG was developed to analyze a company's prospective growth rate within its industry vs. its relative market share. The Growth Market Share Matrix is another name for this. The BCG Matrix of Nestle can assist in the development of a long-term strategic marketing plan for more lucrative items.
It is feasible to determine which goods (or brands/units) a firm should spend more on and which items it should diversify away from by graphing these parameters.
Here are some benefits of applying the BCG Matrix in Nestle:
- It is effortless to use and explain because there are just two dimensions and four quadrants.
- It's a well-known and long-standing strategic approach that's stood the test of time and substantial changes in the competitive landscape.
- The needed data – market growth and relative market share – are usually available to the organization, together with competitor measures, making execution and preparation reasonably simple.
- With the possible exception of the question mark quadrant, clear direction is offered for each quadrant in terms of investment and support of business units (or brands or goods) (please see discussion of the question mark quadrant)
- It's an integrated approach for allocating resources for companies pursuing market share targets and learning curves.
Now, let us know more about Nestle’s BCG Matrix in detail below.
Background of Nestle
Nestlé is the world's largest and most varied food and Beverage Corporation, founded over 150 years ago. Our goods are sold in 186 countries worldwide, giving us a truly global presence. We aspire to produce sustainable, industry-leading financial success and win trust by improving quality of life and contributing to a healthier future.
Baby food, medicinal foods, bottled water, breakfast cereals, coffee and tea, confectionery, dairy, ice cream, frozen meals, pet food, and snacks are among Nestlé's products. Nespresso, Nescafé, Kit Kat, Smarties, Nesquik, Stouffer's, Vittel, and Maggi are among the Nestlé brands with annual sales above CHF1 billion (about US$1.1 billion). Nestlé works in 189 countries and employs around 339,000 people. L'Oreal, the world's largest cosmetics firm, has Nestlé as one of its key owners.
Crosse & Blackwell in 1950, Findus in 1963, Libby's in 1971, Rowntree Mackintosh in 1988, Klim in 1998, and Gerber in 2007 were all acquired.
Now that you have a fair, basic understanding of the BCG matrix and Nestlé's rich history, we can quickly dive into the BCG Matrix of Nestle.Company.
| Company | Nestle |
| Industry | Food Processing |
| CEO | Ulf Mark Schneider |
| Founded | 1866 |
| Location | Switzerland |
| Revenue | 87.1 billion CHF |
The BCG Matrix of Nestle
Nestle is a global food and drinks conglomerate. Probably a dream firm for most B-school students as well. It is present in around 187 countries. Consider how many market segments and strategies it could serve. We must first learn how Nestlé's BCG matrix operates to comprehend its methods.
They maintain a vast brand portfolio with different items to accommodate their highly diverse consumers. Despite this, it continues to lead in the majority of global markets.
The BCG Matrix of Nestle includes Dogs, Stars, Cash Cows, and the Question Mark. We will examine Nestle's low growth goods, items that draw revenue, high growth products, and those that may attract sales or become low growth products.
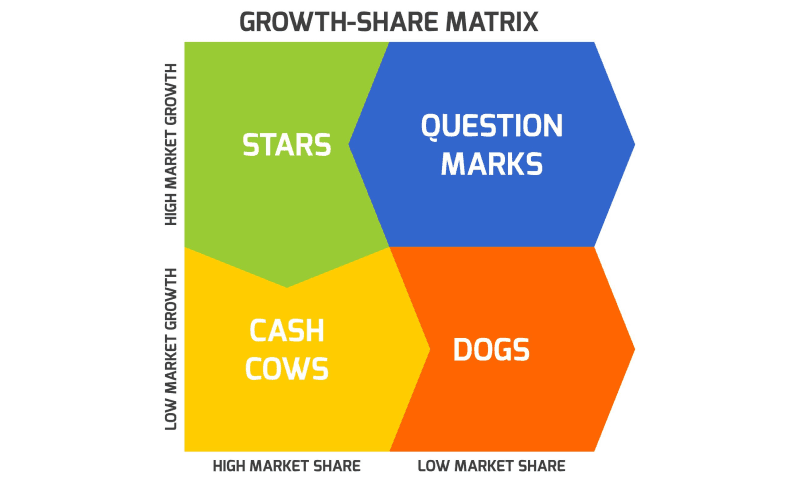
Dogs
These are goods having a small market share or growth potential.
Take, for example, Milo. Nestle introduced Milo as a chocolate and malt powder for milk and water. The product, however, had little influence on the business and was assigned to the dog quadrant of Nestle's BCG Matrix.
Stars
These are well-known goods or brands with tremendous potential for high returns on investment. Nestlé’s mineral water and Nescafe coffee both fall under the star quadrant of the company's BCG matrix.
The company has invested substantially to separate itself from competitors in mature countries and raise brand recognition in new markets due to the rising trend towards healthy lifestyles and emerging markets.
Cash Cows
These are well-established and routinely generate income, but there are few chances for expansion.
Maggi Noodles has a solid market position and significant consumer loyalty, with a market share of 80-85 percent.
To retain market dominance and fight off competitors, the product requires minimal expenditure.
Question Marks
These products are uncertain. They are known as the problem children, and they can either become stars or become dogs.
Another business unit in the BCG Matrix of Nestle in the Question Mark quadrant is chocolates & confectionery. This quadrant is occupied by a product that faces intense competition and has a small market share in its industry. Source: www.unsplash.com
How to Convert PDF Reports Using PDF Agile
PDF Agile is a program that allows users to update their PDF documents rapidly and effortlessly. It works like a word processor, allowing you to reflow text between paragraphs, pages, and columns. This application also allows users to adjust and modify text size, document layout, font, line spacing, and add multimedia. Because customers typically receive reports online in PDF, PPT, pictures, and other formats, this application will offer reports in these formats based on the user's needs.
PDF Agile converter makes it simple for users to set up their electronic file system. Users can also better handle PDF files and document metadata. Users can also utilize PDF Agile to:
- Users can convert various files from Word, Excel, PowerPoint, TXT, pictures, and CAD to PDF without losing formatting.
- Users can use PDF pages to structure and manage their workflows. Split and combine documents; drag and drop pages inside a file or across documents; and easily add stamps, watermarks, headers, and footers.
- Users can improve their digital reading experience by switching between three distinct settings for all circumstances. With one single button press, you may switch between Reader Mode, Full-Screen Mode, and Slideshow.
Key Takeaways
We discovered why businesses want a BCG matrix, what it entails, and why it is an important marketing tool. Nestlé's BCG Matrix shows its extensive product line in mind. The Star, Cash Cow, Question Mark, and Dog are the Matrix's different components.
Then we looked at how Nestle "milked" Maggi, a cash cow. Because Maggi is a well-known brand, this article could have clarified how Nestle benefits from it. Then, according to the quadrant, you can see how to utilize the BCG Matrix of Nestle to pick where to invest and what platform to employ.
References
Business Mavericks Available at: https://businessmavericks.org/bcg-matrix-of-nestle/

