What is a Compare and Contrast Graphic Organizer?
The compare and contrast graphic organizer pdf is an excellent comparison tool for students and professionals. Students use it to map their concepts and ideas to find similarities and differences by comparing their attributes logically. Any compare and contrast chart can compare two entities, people, events, items, and concepts. Professionals use it to make important business decisions and create efficient strategies for their business growth. Using graphic organizers makes it easier to understand any concept or decision. Mainly used compare and contrast graphic organizers include T-charts and Venn diagrams.
Free printable graphic organizer compare and contrast templates are best for students, teachers, and kids for learning. You can use them to write comparison essays or solve complex problems after comparing various solutions to determine which is more efficient. It also helps students arrange their concepts and thoughts to improve their comprehension of any subject or topic. Teachers also use these for homework and classroom exercises.
Benefits of Compare and Contrast Graphic Organizer
The compare and contrast graphic organizer pdf refers to various types of comparison charts and diagrams that students use as a framework to find the difference and similarities between two ideas or characters. Some graphic organizers, such as Venn diagrams, are mainly used in comparing quantities in presentations as they can compare two or more entities in a single framework. Here are some major benefits of using compare and contrast graphic organizers for students and professionals.
- Compare and contrast graphic organizers help students generate ideas, solve complex problems, and improve their understanding of concepts as they visualize their thoughts clearly. As a graphical representation is much easier to understand, students can comprehend any topic after graphically listing and comparing the key points.
- Graphic organizers for comparing two or more entities can quickly draw a relationship between them using connectors and icons. When writing comparison essays or comparing characters in a story, a compare and contrast graphic organizer makes understanding the character much easier.
- Creating business plans and marketing strategies depends on analyzing and comparing data sets. Compare and contrast graphic organizers are to compare data sets logically. It is the same for research, where progress is determined through comparison results for previous experiments.
- Educators use to compare and contrast graphic organizer pdf to download templates and use them for classroom exercises. When teaching a new topic or explaining the similarities and differences between two concepts, teachers prefer using comparison charts as they visualize the comparison between each attribute.
How to Use Compare and Contrast Graphic Organizer
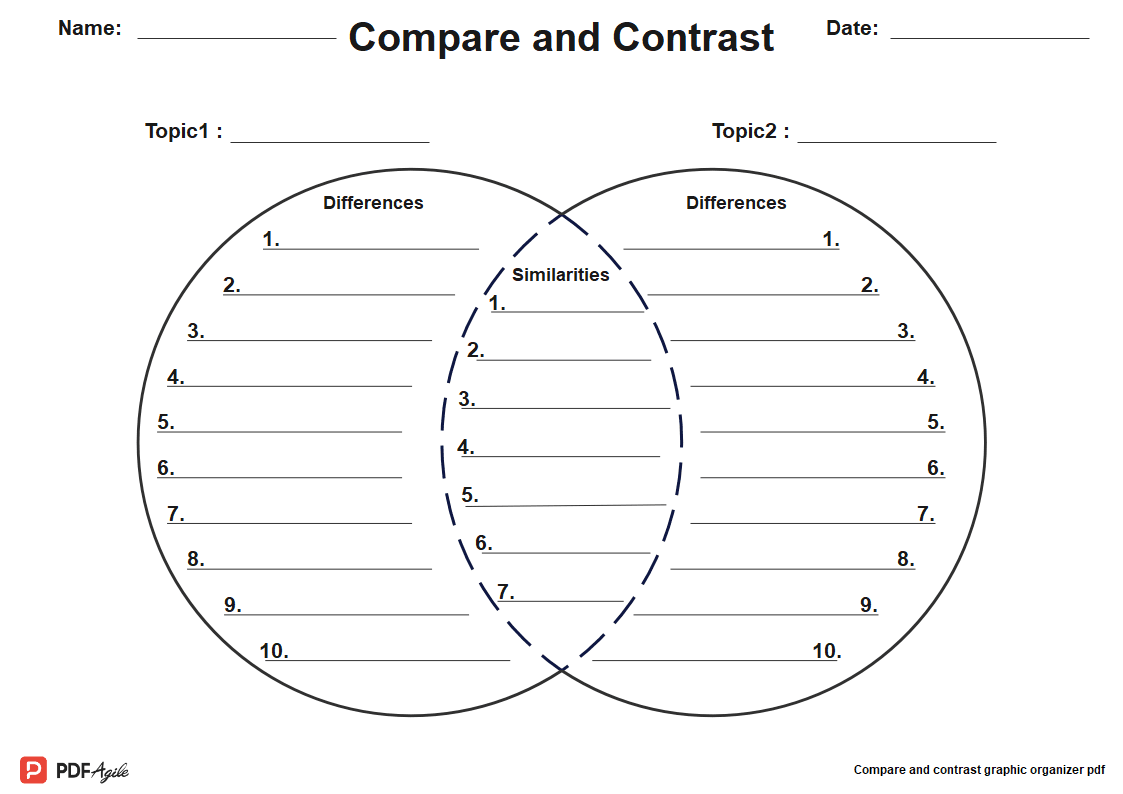
Using compare and contrast graphic organizers help students understand new topics, solve problems, and compare data sets. Some graphic organizers, such as Venn diagrams also used in math and computer subjects. A Venn diagram contains two or three interlocking circles representing the number of entities. The interlocked area of the diagram showcases the similarities between entities or data sets. The remaining areas represent the differences. A clear visual representation allows students to understand and organize their concepts easily. Here is how you can use compare and contrast graphic organizers.
STEP 1: The first step is to identify the problem, data sets, or the key points in any topic before you compare to generate ideas or find a solution using a graphic organizer. Students can go through the problem or organize their thoughts beforehand.
STEP 2: Create a comparison chart using compare and contrast graphic organizer pdf template. There are various types of graphic organizers that you can you to visualize the comparison between two data sets. Select the template according to your requirement. Use T-charts for essay writing and a Venn diagram to compare data sets.
STEP 3: After selecting the template, customize it and enter the data. Every compare and contrast graphic organizer gives you a section to write the similarities and separate the differences. For Venn diagrams, you write the similarities in the area where both circles cross each other.
STEP 4: In T-charts and other column diagrams, you need to write the attributes of both entities on each side of the circle logically. After checking their details, you can write the similarities in the box at the top of the column. You don't have to write the difference in a similar manner.
Free Compare and Contrast Graphic Organizer PDF Template Download
You can easily edit a compare and contrast graphic organizer pdf with a pdf editor. PDF Agile is the best tool for editing and downloading pdf templates with many amazing features that optimizes your pdf workflow. It comes with pro editing tools that allow users to edit, merge, convert, and compress PDF documents without wasting time and effort. PDF Agile supports multiple formats, which enable the user to convert files from PDF to Word, Excel, PPT, TXT, image, and CAD formats. Users can translate pdf into various languages as well.


