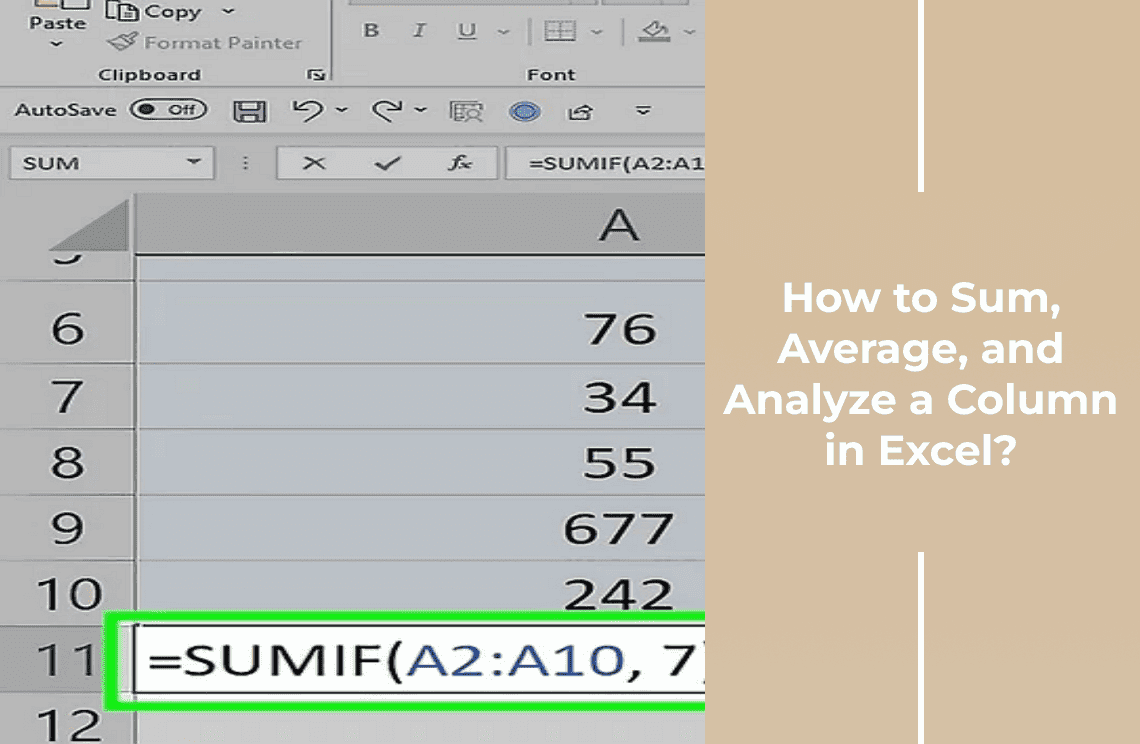
Rapid Procedure! Input your data into a selected range of cells to find the standard deviation in Excel. Now, use =STDEV.S() if your data represents a sample or =STDEV.P() if it represents a population. That’s it!
What is Standard Deviation?
Simply, standard deviation measures the spread of your data points from the average analysis. It answers: “Are my values consistent or highly variable?” Example:
Low Standard Deviation:
Studying for 5, 6, 5, 6, and 5 hours weekly shows numbers close to the average, indicating consistency and a low standard deviation.
High Standard Deviation
The range of study time for 3, 9, 2, 12, and 5 hours weekly indicates high variability and standard deviation.
What is the Standard Deviation in Excel?
Standard deviation in Excel measures data dispersion around the mean. It quantifies the variation or spread of dataset values. Use =STDEV.S range for sample data and =STDEV.P range for population data for calculation. It helps analyze how data points differ from the average.
Quick Solution: Calculating Standard Deviation in Excel?
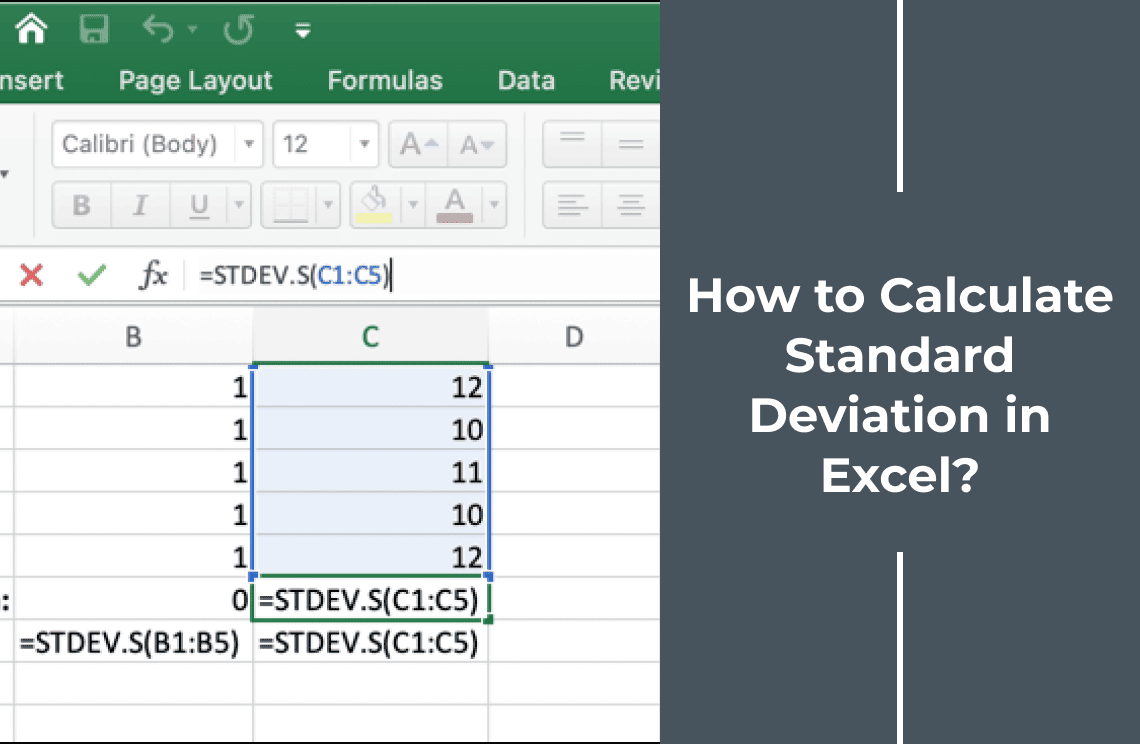
First enter your data in Excel and use STDEV.P() for populations or STDEV.S() for samples range. However, STDEV.P() divides by total data points and STDEV.S() divides by n-1 for sample variability.
So, if your data is in cells B2 to B31. Use =STDEV.P(B2:B31) for the population or =STDEV.S(B2:B31) for the sample. Excel will calculate the standard deviation.
Real-world Applications of Standard Deviation
- Quality Control: Measures the consistency of products in manufacturing.
- Finance: Assesses the volatility and risk of investments.
- Education: Evaluates the spread of students' test scores.
- Weather Forecasting: Analyzes the variability in temperature or rainfall data.
- Healthcare: Monitors the variation in patient recovery times.
- Market Research: Assesses the spread of consumer preferences in surveys.
- Performance Analysis: Evaluates the consistency of athletes' performances.
Types of Standard Deviation
- Population Standard Deviation: Measures the spread of data for an entire population.
- Sample Standard Deviation: Estimates the spread of data within a sample, using ( n - 1 ) (Bessel’s correction) in the calculation.
Difference Between
|
|
Standard Deviation Formulas
The population standard deviation formula (σ) is:
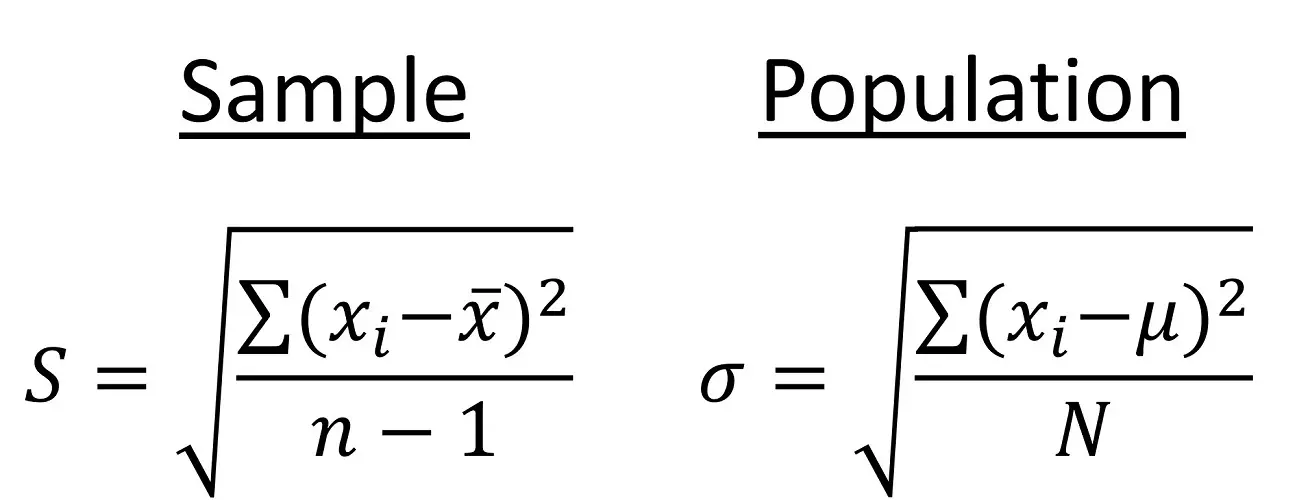
Here:
- N is the total number of data points in the population.
- xᵢ represents each individual data point.
- μ is the population mean (average).
The formula determines the average of the squared deviations from the mean and then computes the square root of this average.
Sample standard deviation (s) Formula is:
Here we use n in lowercase for convention.
Here:
- n is the number of data points in the sample.
- xᵢ is each individual data point.
- x̄ is the sample mean (average).
This formula uses ( n - 1 ) (Bessel's correction) to ensure the sample standard deviation unbiasedly estimates the population standard deviation.
Why STDEV.S is More Common?
STDEV.S is more common because we usually work with a sample of data, not the entire population. Since complete data sets are rare, STDEV.S is the go-to option.
How to Calculate Standard Deviation in Excel?
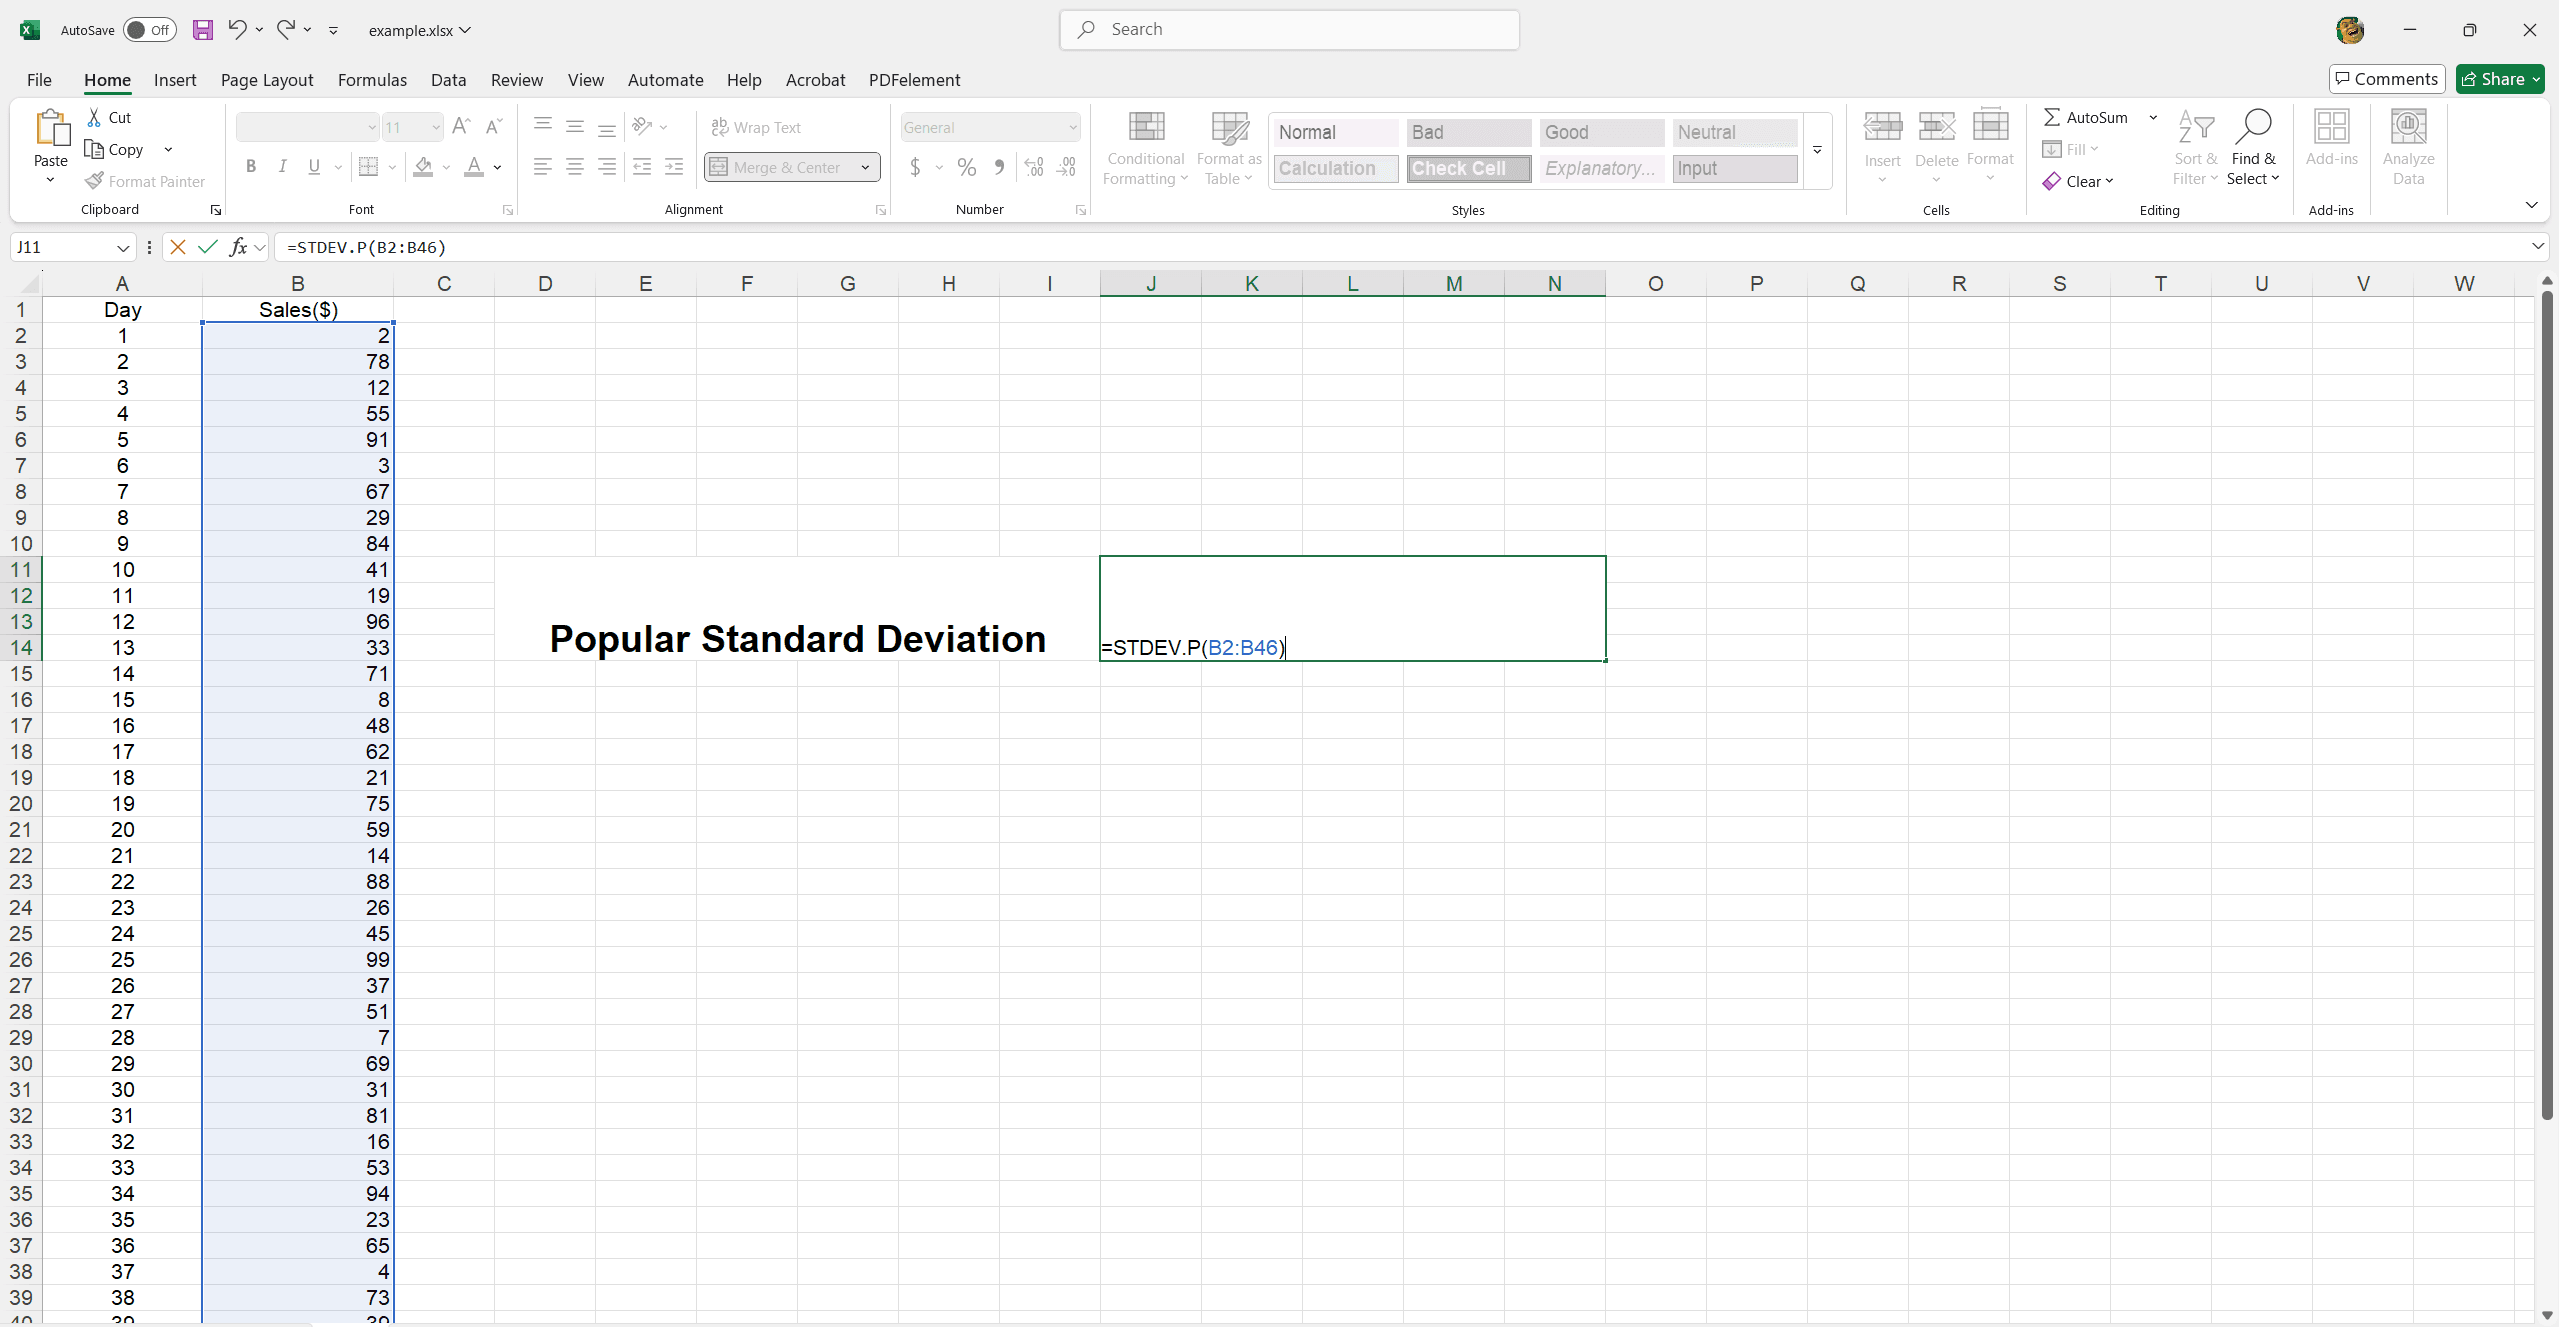
1. Enter Your Sales Data: Open Excel and put each day's sales number in a single column, say from cell B2 down to B31.
2. Calculate Population Standard Deviation (if you have ALL the data):
Go to an empty cell (like E6). Type this formula: =STDEV.P(B2:B31) and Press Enter. This number tells you the average amount your daily sales differ from the average daily sales for the entire month.
3. Calculate Sample Standard Deviation (if your data is just a SNAPSHOT):
If your 30 days of data is just a sample of a longer period (like trying to guess the whole year's variation), go to another empty cell. Type this formula: =STDEV.S(B2:B31) and Press Enter.
This gives you an estimate of the sales variation you might see over a larger period. Understand the Result: The standard deviation number tells you how spread out your daily sales are.
4. A small number means your daily sales are pretty consistent.
5. A large number means your daily sales vary a lot.
How to Interpret Standard Deviation Values?
To better interpret the standard deviation, we can also calculate the mean of our sales data using the following equation.
In cell E7, the mean value is calculated to be $975, as illustrated below.
How to Add Standard Deviation Bars In Excel?
Integrating standard deviation bars into our Excel charts provides a clear visual representation of data variability.
1. Highlight the data range from B2 to B31 in your example.
2. Navigate to the Insert tab.
3. Choose your preferred chart type (e.g., line chart) as illustrated in the image below.
4. Insert the chart.
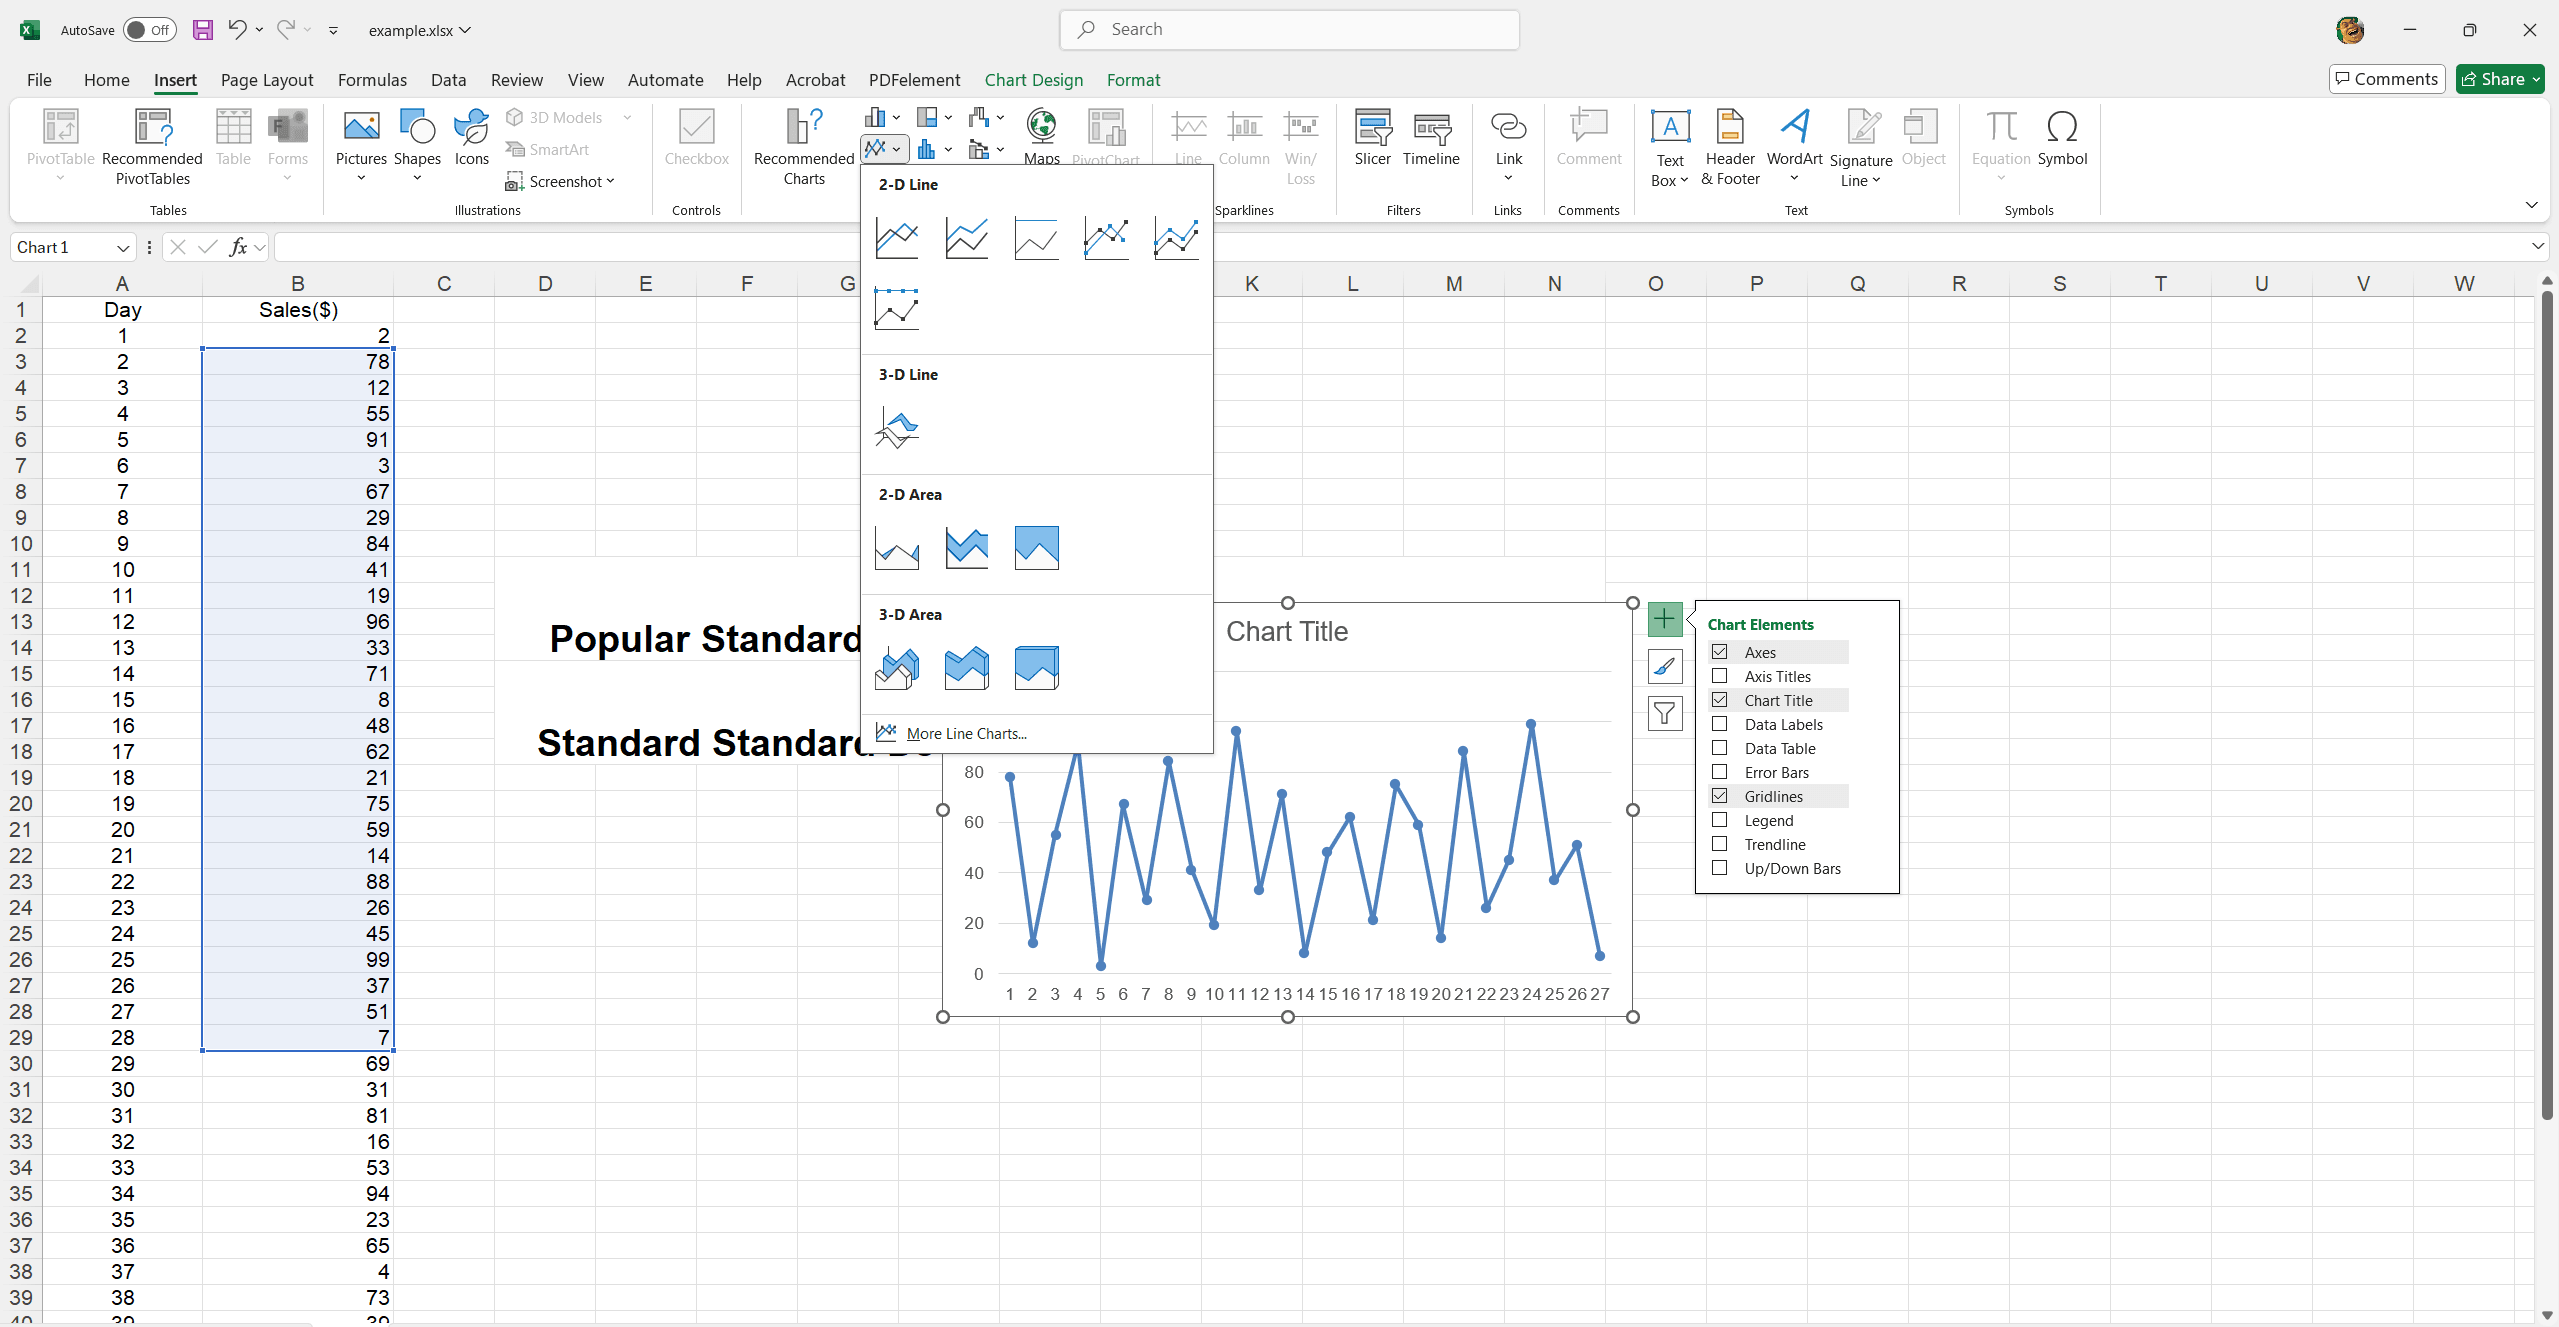
A basic line chart will appear below.
1. Highlight your data series in the chart. Go to the Chart Design tab.
2. Click Add Chart Element in the Chart Layouts group.
3. Move your cursor over Error Bars.
4. Choose Standard Deviation to include standard deviation bars in the line chart.
5. Hover over Error Bars and click More Error Bar Options to adjust color, width, and style.
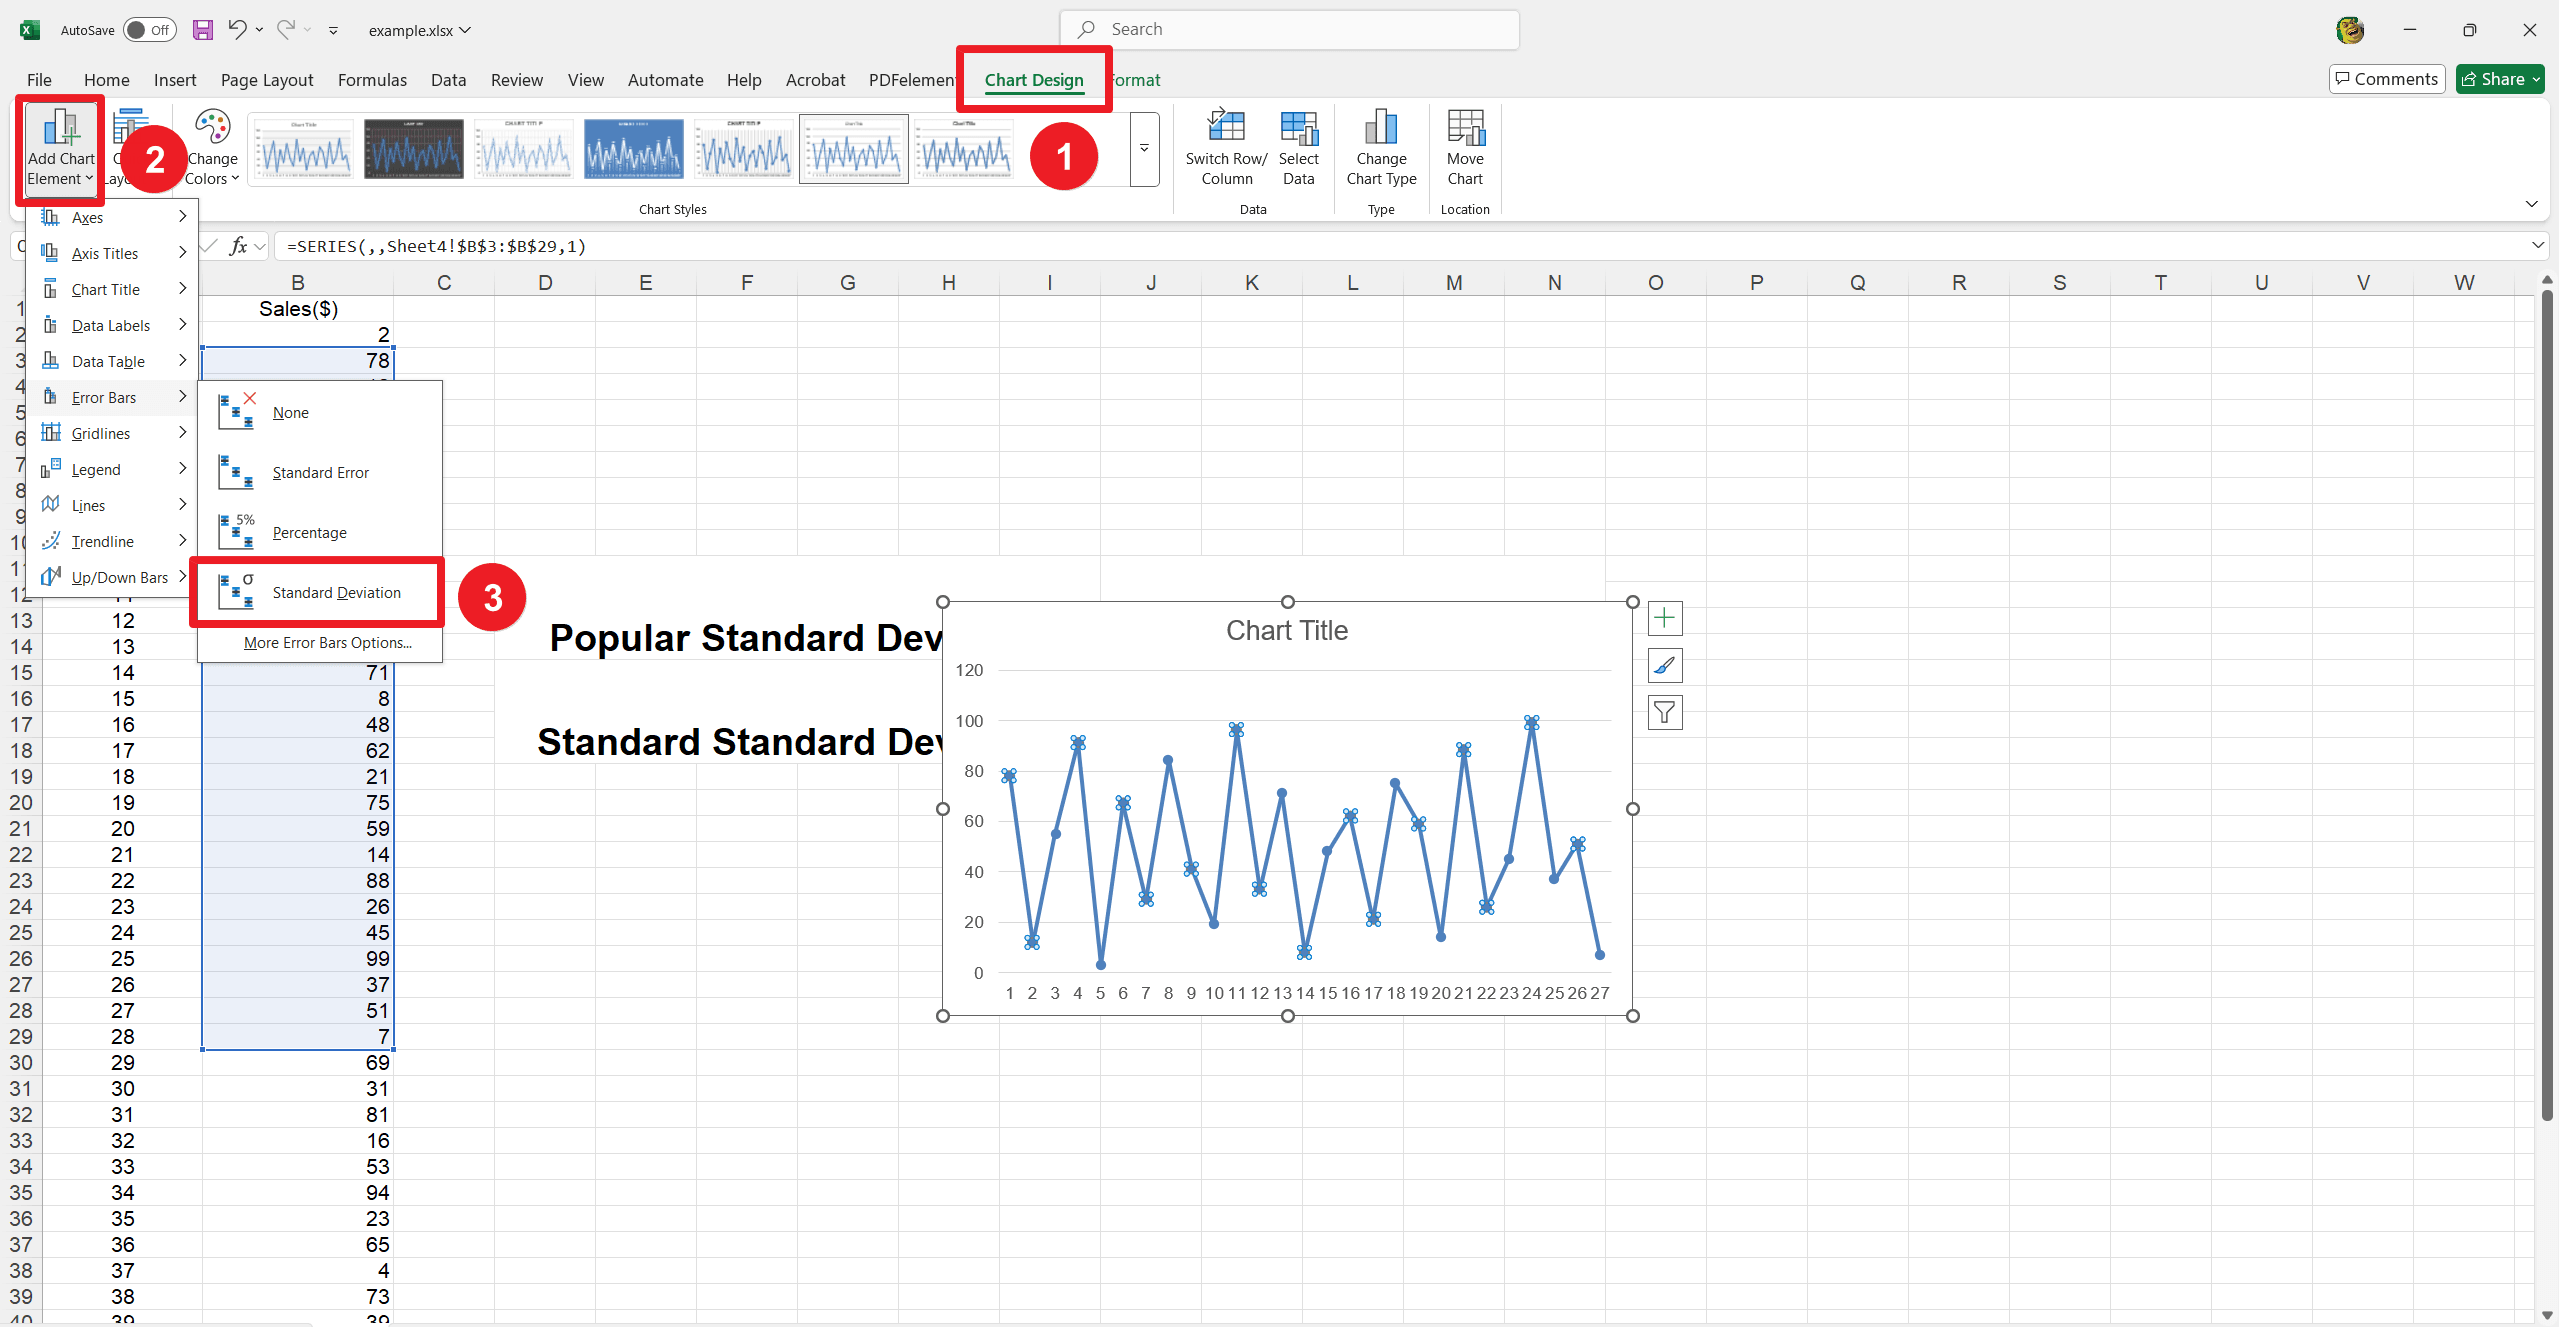
6. Fine-tune these settings in the Format Error Bars panel until you achieve your desired look.
Final Thoughts
Understanding and using standard deviation, significantly STDEV.S can change how you look at your data. Whether you're tracking study hours or business metrics, getting a grip on consistency versus variability is helpful. So, next time you dive into your numbers, remember that a little statistical know-how can make all the difference. Happy number-crunching!
And if you're hungry for more Excel tips or just curious about new tricks to boost your skills, don't forget to check out some great resources at PDF Agile. They've got fantastic Excel Tips and How-To Guides that can take your data game to the next level!